This article explains how to enable logging in OpenSplice. It covers the different logging mechanisms that the different OpenSplice services use. This will allow you to get extra diagnostic information to find out what is happening in the system.
Domain Service Logging
The OpenSplice Domain Service logging is on by default in OpenSplice. The domain service writes out two log files during normal operation. By default you will find these logs in the directory where the application starts.
The logs are:
- ospl-info.log – which contains information about the running of OpenSplice
- ospl-error.log – contains any error messages from OpenSplice
These files log all the error and information events that occur while OpenSplice is running. The information in these log files allows you to determine what is going on in the system.
Can I change the location where the log files are written?
For example OSPL_LOGPATH=C:/log will send the files into the log directory on a windows system.
Can I change the names of the default log files?
If you want to change the names of the default log files you can do this by setting the environment variables:
OSPL_INFOFILE – for the ospl-info.log
OSPL_ERRORFILE – for the ospl-error.log
For example to rename the ospl-info.log to info.log you would set OSPL_INFOFILE=info.log
OSPL_INFOFILE can also be set to standard out by specifying <stdout> and/or OSPL_ERRORFILE to standard error by specifying <stderr>.
Can I change the verbosity of the log files?
There are two ways you can change the verbosity of the log files. These are
- using an environment variable
- setting the verbosity in the configuration xml file OpenSplice uses.
The different values you can set for the verbosity are as follows:
- 0 – DEBUG
- 1 – INFO
- 2 – WARNING
- 3 – API_INFO
- 4 – ERROR
- 5 – CRITICAL
- 6 – FATAL
- 7 – REPAIRED
- 8 – NONE
The level specified as this attribute is the lowest level that will be emitted to the logs. All logging can be suppressed by specifying the value 8 or NONE. The default value is INFO.
Setting the verbosity with an environment variable.
To change the verbosity of the log file you need to use the environment variable OSPL_VERBOSITY. This should be set to the value of the verbosity you want to use.
For example to set the verbosity to debug you would set OSPL_VERBOSITY=DEBUG or OSPL_VERBOSITY=0
Setting the verbosity with the OpenSplice Configuration File
The verbosity of the log files is controlled in the Opensplice configuration file. To change the verbosity you need to add the Report element to the xml file in the Domain section.
This is an example of how you can change the xml file to set the verbosity to API_INFO.
<Domain>
<Report verbosity=”API_INFO”/>
</Domain>
You can also use the value 3. It is advisable to edit this file using the OpenSplice Configuration Editor which checks the configuration for errors.
Using the OpenSplice Configuration Editor to set the report verbosity
To change the verbosity using the OpenSplice Configuration Editor start the editor using the command
osplconf
or start it from the Launcher.
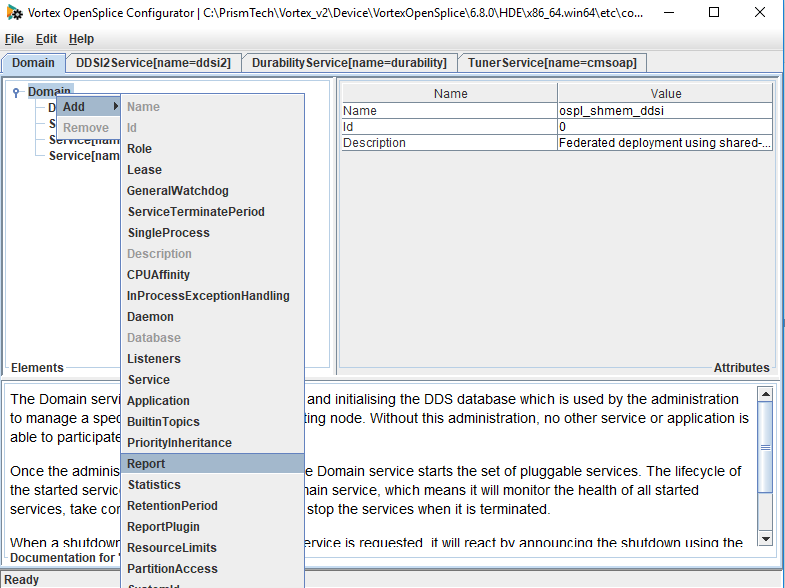
When the interface appears go to the Domain and right click on Domain. Choose Add > Report from the drop down menu.
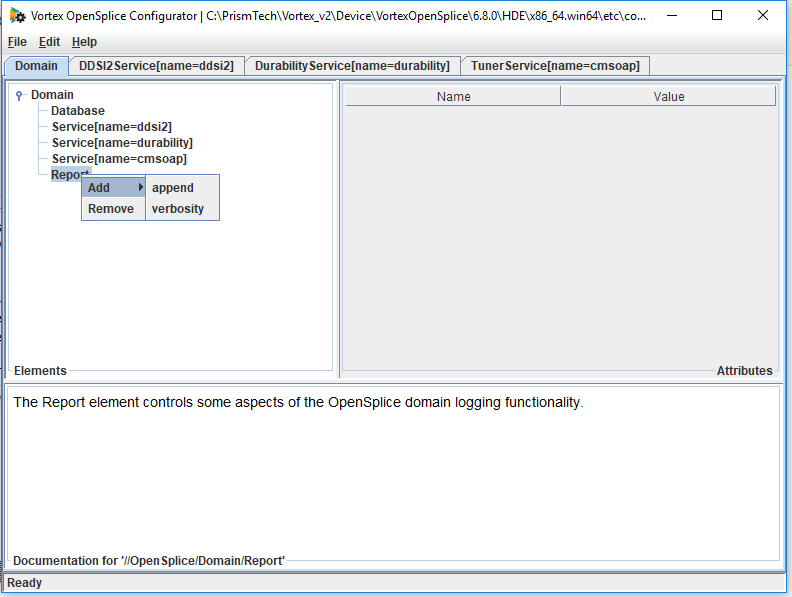
This will add Report to the list on the left hand side. Right click on this and choose Add > Verbosity from the menu.
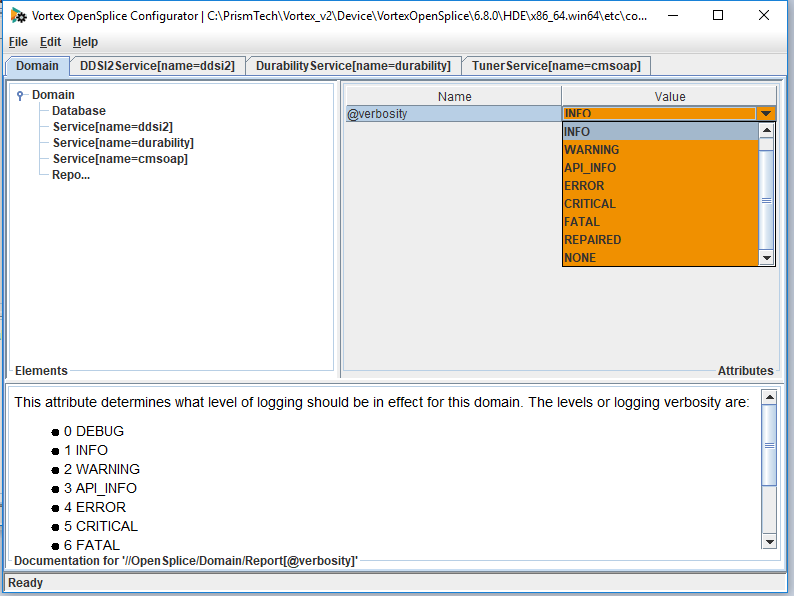
The verbosity will appear on the right hand side. To change the level of the verbosity click in the box and edit the level from the drop down list.
Can I create new log files when I restart the domain?
When you restart the domain you can either append to the previous error log and info log files or you can delete the previous files and create new ones. This can be done in two ways:
- using an environment variable
- setting the append attribute in the configuration xml file OpenSplice uses.
Changing how the log file appends with an environment variable.
To change whether the log file appends to the previous file or starts a new file when you restart you need to use the environment variable OSPL_LOGAPPEND. By default the value is set to true. This means the file will append to the previous file on a restart.
To start a new file on restart you need to set OSPL_LOGAPPEND=false.
Changing how the log file appends with the configuration file.
By default the information is appended to the log file when the domain is restarted. To start a new log file when the domain restarts you need add the Report element to the xml file in the Domain section.
This is an example of how you can change the xml file to set append to false.
<Domain>
<Report append=”false”/>
</Domain>
It is advisable to edit this file using the OpenSplice Configuration Editor which checks the configuration for errors.
Using the OpenSplice configuration editor to change the append setting
To change the verbosity using the OpenSplice Configuration Editor start the editor using the command
osplconf
or start it from the Launcher.
When the interface appears go to the Domain and right click on Domain. Choose Add > Report from the drop down menu.
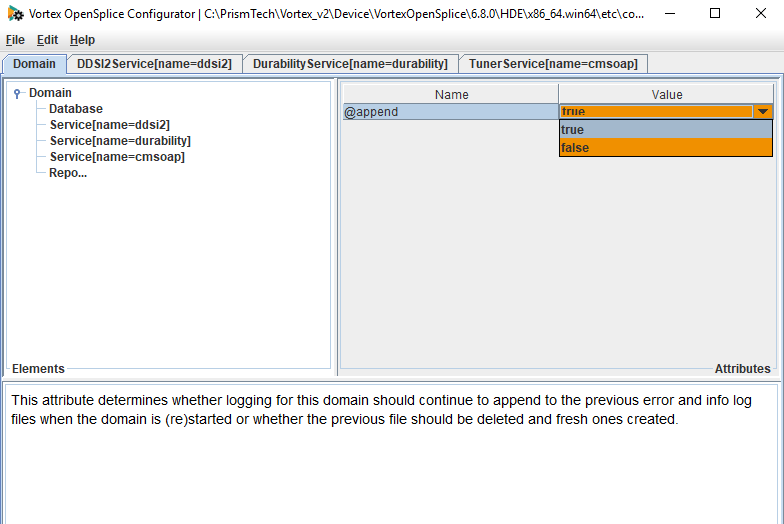
This will add Report to the list on the left hand side. Right click on this and choose Add > Append from the menu.

The append will appear on the right hand side. To change the append from true to false click in the box and edit the level from the drop down list.
Is there a way to log all the discovered entities in the system?
If you are using OpenSplice V6.9.2p1 or above then you can turn on logging for the builtin topics. This allows you to specify a logfile which contains a line for each builtin topic update of all the discovered entities.
To do this you need to the logfile attribute to the OpenSplice/Domain/BuiltinTopics section in the xml file. This should be set to the path of the file you want to use. The default value is builtin.log.
This is an example of the configuration file:
<OpenSplice>
<Domain>
<Name>DomainName</Name>
<BuiltinTopics enabled=”true” logfile=”builtin.log”>
</Domain>
</OpenSplice>
Using the OpenSplice configuration editor to add the logfile setting
To add the logfile setting using the OpenSplice Configuration Editor start the editor using the command
osplconf
or start it from the Launcher.
When the interface appears open the xml file you are using from the menu. Choose File > Open and choose the xml file you are using.
In the Domain tab right click on domain and choose Add > BuiltinTopics
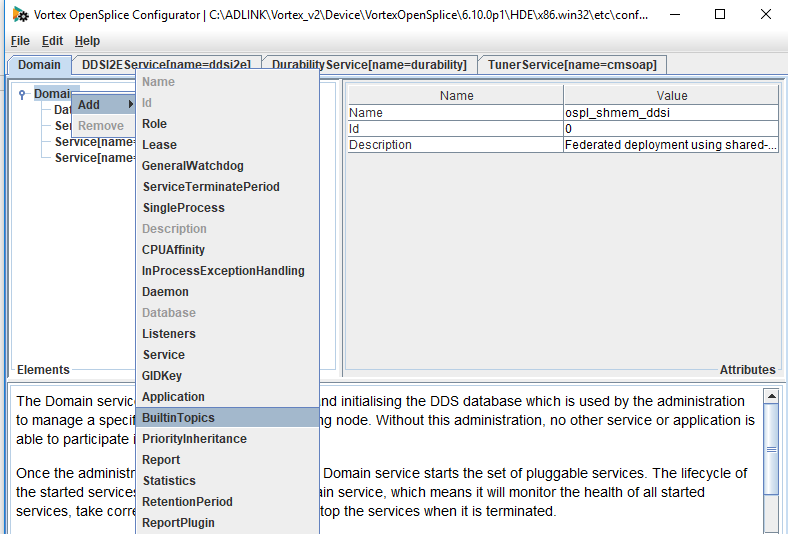
The BuiltinTopics should appear in the list.
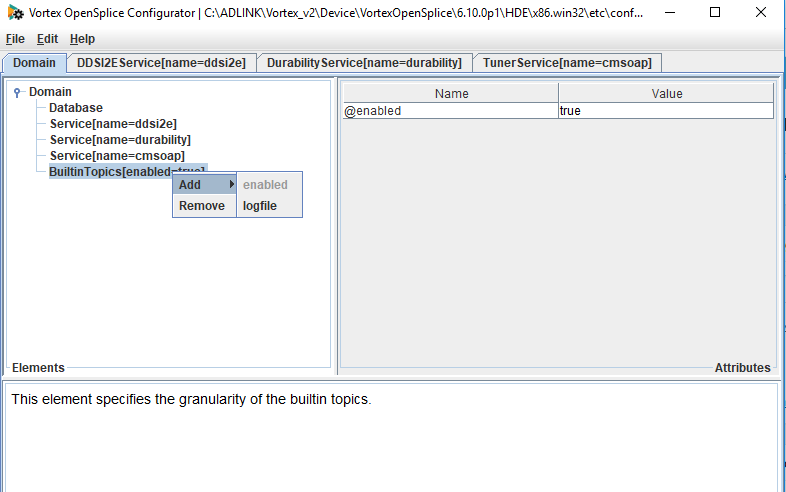
Right click on BuiltinTopics and choose Add >Logfile.
The logfile option should appear in the right hand pane and you can change the value by clicking on it.
Durability Service Logging
By default durability service logging is turned off for performance reasons. In order to analyse the behaviour of durability services throughout a domain there may be occasions when the logging needs to be enabled. This can be done in the xml configuration file.
How can I enable durability service logging?
To enable durability service logging you need to add the Tracing element into the Durability Service section of the xml file. This element controls the amount and type of information that is written into the tracing log by the Durability Service.
This is an example of how to add the Tracing element into the xml configuration file.
<DurabilityService name=”durability”>
<Tracing>
<Verbosity>INFO</Verbosity>
</Tracing>
</DurabilityService>
It is best to edit the xml file using the osplconf tool.
Can I change the location where the durability log file is written?
OutputFile specifies where the durability log file is written to. By default this is an empty string and logging is disabled.
To add a location for the OutputFile you need to add the OutputFile element under the tracing section of the Durability logging. The value “stdout” is considered a legal value that represents “standard out” and “stderr” is a legal value representing “standard error”. The value can also be set to the filename. If this is not set the logging will not be saved to a file.
An example of the configuration file:
<DurabilityService>
<Tracing>
<Verbosity>INFO</Verbosity>
<OutputFile>durability.log</OutputFile>
</Tracing>
</DurabilityService>
Can I change the verbosity of the durability service log?
The durability service supports various verbosity levels. These are:
- SEVERE
- WARNING
- INFO
- CONFIG
- FINE
- FINER
- FINEST
- NONE
The higher the verbosity level the more detailed the information. The default value is INFO. The most verbose level is FINEST.
The verbosity can be changed in the xml configuration file. When you have added the Tracing element you just need to set the verbosity to the value you want to use. For example to set the verbosity to FINEST:
<DurabilityService name=”durability”>
<Tracing>
<Verbosity>FINEST</Verbosity>
</Tracing>
</DurabilityService>
How can I add timestamps into the durability service log?
Timestamps are enabled in the durability service log by default. If you wish the turn the timestamps off you can do this in the xml configuration file. To do this you need add a timestamps section into the Tracing element of the xml file and set it to false, for example like this:
<DurabilityService name=”durability”>
<Tracing>
<Verbosity>INFO</Verbosity>
<Timestamps>false</Timestamps>
</Tracing></DurabilityService>
Can I make the timestamps absolute?
By default the timestamps are absolute. It is possible to change this so that the timestamps are relative to the startup time of the service. This can be done by adding the absolute value into the timestamps section in the xml file. To set the timestamps to be relative to the startup time of the service this value should be set to false. The default value is true.
An example of how to do this in the xml file is shown:
<DurabilityService name=”durability”>
<Tracing>
<Verbosity>INFO</Verbosity>
<Timestamps absolute=”false”>true</Timestamps>
<OutputFile>durability.log</OutputFile>
</Tracing>
</DurabilityService>
Can I make the tracing log synchronous?
There may be occasions when you want the tracing log updates to be synchronous. When this is enabled the logging updates are immediately flushed to disk with no buffering. This may add a performance overhead. This can be useful if you are debugging and want all the tracing information to be caught on disk when the service crashes. By default this is false
To enable synchronous logging you need to add the synchronous element into the Tracing element of the xml file and set it to true. The following xml snippet shows an example of how to do this:
<DurabilityService name=”durability”>
<Tracing synchronous=”true”>
<Verbosity>INFO</Verbosity>
<OutputFile>durability.log</OutputFile>
</Tracing>
</DurabilityService>
Enabling durability service logging with the OpenSplice configuration tool
It is always advisable to modify your xml configuration files with the OpenSplice configuration tool. This enables you to edit your files with the graphical interface and has built in error checking to ensure the xml file is valid. To start the configuration tool either start it from the launcher or use the command
osplconf
in an command window that has been configured for OpenSplice. When the configuration tool appears open the xml file you wish to edit using File >Open and choosing the right xml file.
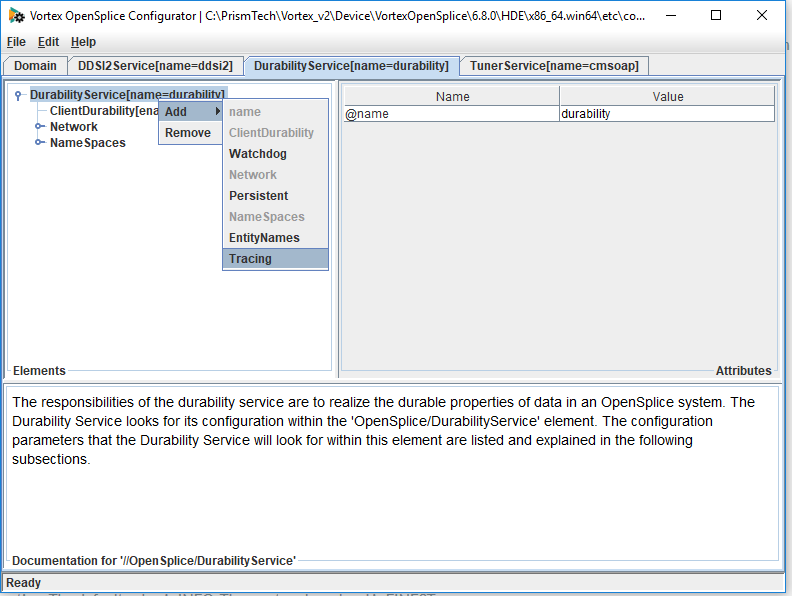
To enable durability service tracing click on the tab that says DurabilityService then right click on DurabilityService and choose Add > Tracing from the menu that appears. The tracing element should appear in the box on the right hand side.
Once the Tracing element is available you can add synchonous, Outputfile, Timestamps and Verbosity as required by right clicking Tracing and choosing to add the required item.
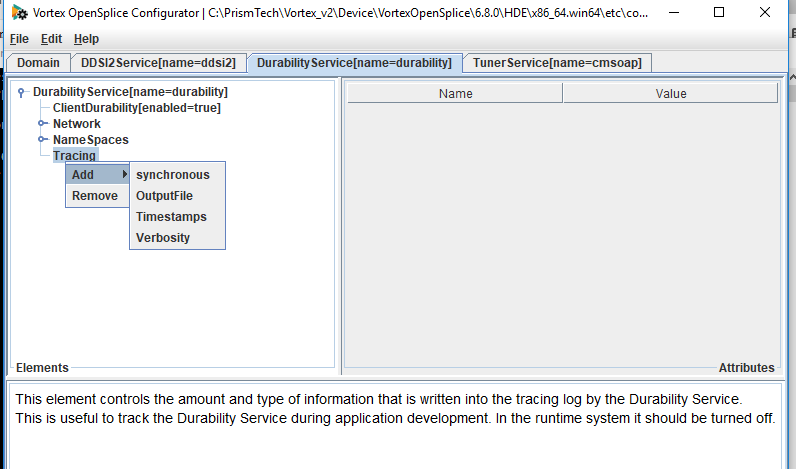
Once the elements are available the values can be changed by clicking in the drop down box and choosing the values you need.
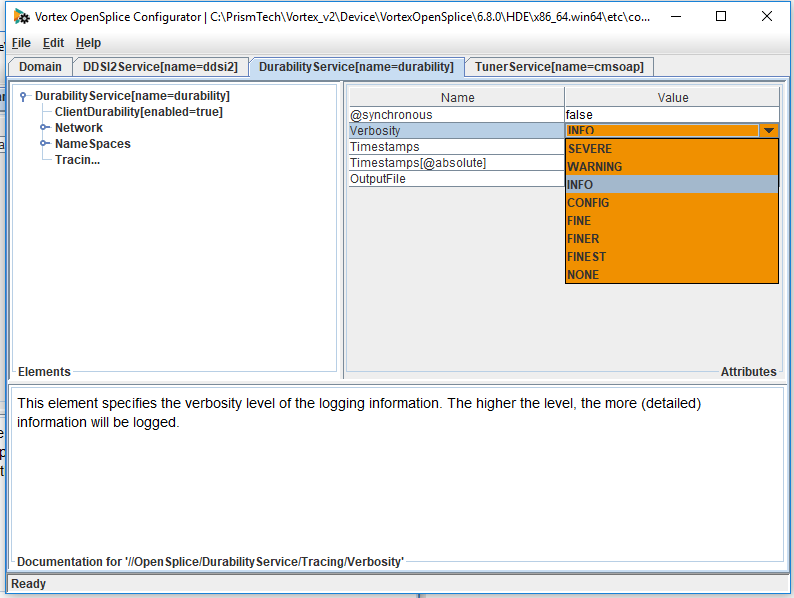
If you want to change the value of the timestamps from the default value of true you need to add the absolute value. This can be done by choosing Timestamps in the right hand box, right clicking and choosing Add > Absolute. Once the value appears in the right hand side you can change this value to false.
Networking Service Logging
By default the Networking Service logging is turned off. You may want to turn networking service logging on while you are developing your application in order to trace what it is doing. To modify the xml file it is best to use the OpenSplice configuration tool as it checks the xml is valid.
How can I enable networking service logging?
To enable networking service logging you need to add the Tracing element into the NetworkService section of the configuration xml file.
This is an example of how to add the Tracing element into the xml file:
<NetworkService name=”networking”>
<Tracing>
<Categories/>
</Tracing>
</NetworkService>
By default the output will get written to standard.out.
The NetworkService logging also has an enabled element in the Tracing section. This indicates if the logging is enabled and it is turned on by default. If you wish to turn the logging off you can set this value to false.
An example of an xml file that turns off the networking service logging is shown below:
<NetworkService name=”networking”>
<Tracing enabled=”true”>
<OutputFile>networking.log</OutputFile>
<Categories/>
<Timestamps absolute=”false”>false</Timestamps>
</Tracing>
</NetworkService>
Can I change the location where the Networking Service logging is written?
To change the location where the Networking Service log is written to you can add the OutputFile element into the Tracing section in the NetworkService section of the xml file. The default value is an empty string which indicates the tracing log will be written to standard out. You can also use the value “stdout” to represent standard out. The value can be set to the path and file name you want the networking log to be written to.
An example of an xml file that shows the networking log being written to a file called networking.log is shown below:
<NetworkService name=”networking”>
<Tracing>
<OutputFile>networking.log</OutputFile>
</Tracing>
</NetworkService>
Can I change the verbosity of the Networking Service log?
The networking service allows you to set the verbosity value for the log as a whole. If you are only interesting in a particular subset of networking behaviour you can set the logging for different categories to different values.
The following log levels can be set for the networking service log:
- none: logging
- severe: error and fatal
- warning: severe + warning
- info: warning + info
- config: info + config
- fine: config + discovery
- finer: fine + traffic and timing
This is an example of an xml file where the verbosity is set:
<NetworkService name=”networking”>
<Tracing enabled=”true”>
<OutputFile>networking.log</OutputFile
<Categories/>
<Verbosity>info</Verbosity>
</Tracing>
</NetworkService>
To change the verbosity of different networking categories.
The Categories section of the Networking Service xml file allows you to enable and disable different categories of logging for the networking service. It also allows you to modify the verbosity of the logging. If you have set the verbosity of the networking log as a whole you can override the setting by using the categories.
You can choose to capture all the categories or just look at certain ones. Each category has a logging verbosity level set using numbers. 0 means no logging and 6 is the most detailed logging level. The default value is 0.
The mapping between the overall verbosity level and the category verbosity level is as follows:
- none: level 0 (no Networking log)
- severe: level 1
- warning: level 2
- info: level 3
- config: level 3
- fine: level 4
- finer: level 5
- finest: level 6
What do the different categories of logging capture?
The different categories of logging are as follows:
- Default
- Configuration
- Constuction
- Destruction
- Mainloop
- Groups
- Send
- Receive
- Throttling
- Test
- Discovery
The following xml file shows an example of how categories are enabled. This will add the default category and capture all the network service logging
<NetworkService name=”networking”>
<Categories/>
<Timestamps absolute=”false”>false</Timestamps>
</Tracing>
</NetworkService>
Default Category
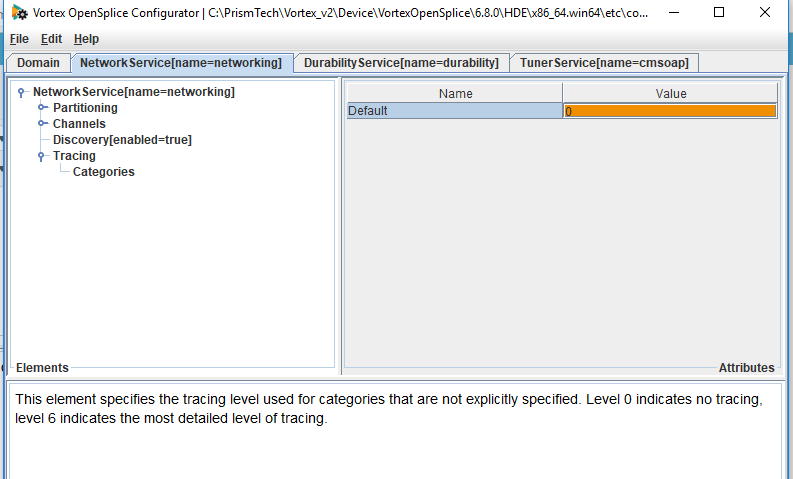
If you enable this category all the other networking service logging categories are captured. This category is enabled by default. By default the tracing level is set to zero which does not provide logs. The verbosity can be changed by using integer values between 0 and 6. 6 will provide the maximum level of logging.
An example of an xml file that sets the Default Category logging to 6 is shown below:
<NetworkService name=”networking”>
<Tracing>
<OutputFile>networking.log</OutputFile>
<Categories>
<Default>6</Default>
</Categories>
</Tracing>
</NetworkService>
Configuration category
The configuration category captures information about the processing of the Networking Service parameters in the xml configuration file. The values can be set to integers between 0 and 6. Level 0 gives no tracing. Level 6 gives the most detailed tracing.
An example of an xml file that sets the configuration category of networking logging is shown below:
<NetworkService name=”networking”>
<Tracing>
<OutputFile>networking.log</OutputFile>
<Categories>
<Configuration>4</Configuration>
</Categories>
</Tracing>
</NetworkService>
Construction category
The construction category enables tracing of the creation of all internal processing entries. It can be set to integer values between 1 and 6. Level 0 indicates no tracing. Level 6 is the most detailed level of tracing.
An example of an xml file that enables the construction category is shown below
<NetworkService name=”networking”>
<Tracing>
<OutputFile>networking.log</OutputFile>
<Categories>
<Construction>3</Construction>
</Categories>
</Tracing>
</NetworkService>
Destruction Category
The destruction category enables tracing of the destruction of the internal processing entities when the service stops. It can be set to integer values between 1 and 6. Level 0 indicates no tracing. Level 6 is the most detailed level of tracing.
An example of an xml file that enables the destruction category is shown below:
<NetworkService name=”networking”>
<Tracing>
<OutputFile>networking.log</OutputFile>
<Categories>
<Destruction>6</Destruction>
</Categories>
</Tracing>
</NetworkService>
Mainloop Category
The Mainlool category traces information about each of the threads spawned by the NetworkService and what they are doing. It can be set to integer values between 1 and 6. Level 0 indicates no tracing. Level 6 is the most detailed level of tracing.
An example of an xml file that sets the Mainloop category logging is shown below:
<NetworkService name=”networking”>
<Tracing>
<OutputFile>networking.log</OutputFile>
<Categories>
<Mainloop>3</Mainloop>
</Categories>
</Tracing>
</NetworkService>
Groups
The Groups category traces the management of local groups (partition-topic combinations). It can be set to integer values between 1 and 6. Level 0 indicates no tracing. Level 6 is the most detailed level of tracing.
An example of an xml file that sets the Groups category logging is shown below:
<NetworkService name=”networking”>
<Tracing>
<OutputFile>networking.log</OutputFile>
<Categories>
<Groups>3</Groups>
</Categories>
</Tracing>
</NetworkService>
Send
The Send category traces information about outgoing data. It can be set to integer values between 1 and 6. Level 0 indicates no tracing. Level 6 is the most detailed level of tracing.
An example of an xml file that sets the Send category is shown below:
<NetworkService name=”networking”>
<Tracing>
<OutputFile>networking.log</OutputFile>
<Categories>
<Send>4</Send>
</Categories>
</Tracing>
</NetworkService>
Receive
The Receive category traces information about incoming data. It can be set to integer values between 1 and 6. Level 0 indicates no tracing. Level 6 is the most detailed level of tracing.
An example of an xml file that sets the Receive category is shown below:
<NetworkService name=”networking”>
<Tracing>
<OutputFile>networking.log</OutputFile>
<Categories>
<Receive>4</Receive>
</Categories>
</Tracing>
</NetworkService>
Throttling
<NetworkService name=”networking”>
<Tracing>
<OutputFile>networking.log</OutputFile>
<Categories>
<Throttling>4</Throttling>
</Categories>
</Tracing>
</NetworkService>
Test
The Test category is a reserved category which is used for testing purposes. It can be set to integer values between 1 and 6. Level 0 indicates no tracing. Level 6 is the most detailed level of tracing.
<NetworkService name=”networking”>
<Tracing>
<OutputFile>networking.log</OutputFile>
<Categories>
<Test>4</Test>
</Categories>
</Tracing>
</NetworkService>
Discovery
The Discovery category traces all the activity related to the discovery channel. It can be set to integer values between 1 and 6. Level 0 indicates no tracing. Level 6 is the most detailed level of tracing.
<NetworkService name=”networking”>
<Tracing>
<OutputFile>networking.log</OutputFile>
<Categories>
<Discovery>4</Discovery>
</Categories>
</Tracing>
</NetworkService>
Can I add timestamps to the Networking Service log?
By default timestamps are written into the log file. If you want to turn timestamps off you can do this by adding the timestamps element to the Tracing section. To turn the timestamps off this should be set to false. The default value is true.
An example of an xml file that turns the networking logging timestamps off is shown below:
<NetworkService name=”networking”>
<Tracing>
<OutputFile>networking.log</OutputFile>
<Categories/>
<Timestamps>false</Timestamps>
</Tracing>
</NetworkService>
Can I make the timestamps absolute?
By default the timestamps are absolute. If you want to make the timestamps relative to the start up of the service you can do this adding the absolute element into the timestamps section in the xml file. By default the value is true. To get relative timestamps this should be set to false.
An example of an xml file that does this is shown below.
<NetworkService name=”networking”>
<Tracing>
<OutputFile>networking.log</OutputFile>
<Categories/>
<Timestamps absolute=”false”>false</Timestamps>
</Tracing>
</NetworkService>
Enabling networking tracing using the OpenSplice configuration tool
It is always advisable to modify your xml configuration files with the OpenSplice configuration tool. This enables you to edit your files with the graphical interface and has built in error checking to ensure the xml file is valid. To start the configuration tool either start it from the launcher or use the command
osplconf
in an command window that has been configured for OpenSplice. When the configuration tool appears open the xml file you wish to edit using File >Open and choosing the right xml file.
To enable durability service tracing click on the tab that says NetworkingService then right click on NetworkingService and choose Add > Tracing from the menu that appears. The tracing element should appear in the box on the right hand side.
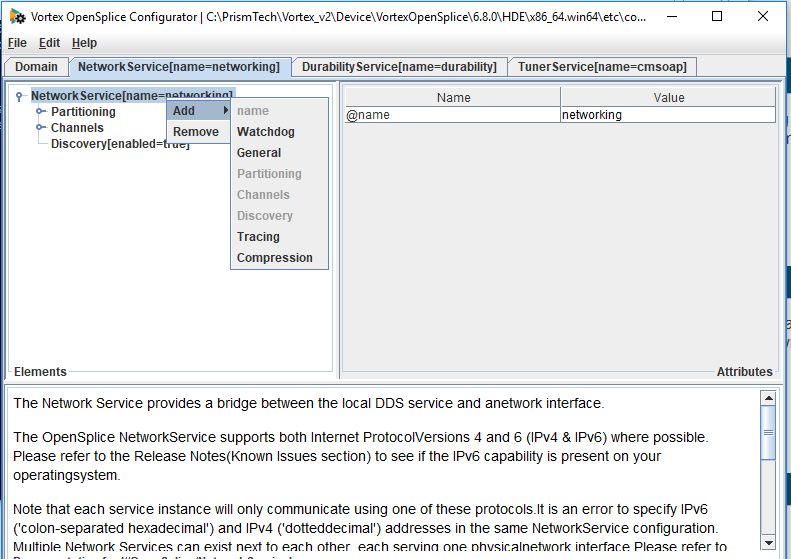
The Networking logging will be added and you can modify the name and the path for the OutputFile by clicking in the box. To add enabled or timestamps right click on tracing and choose the relevant option.
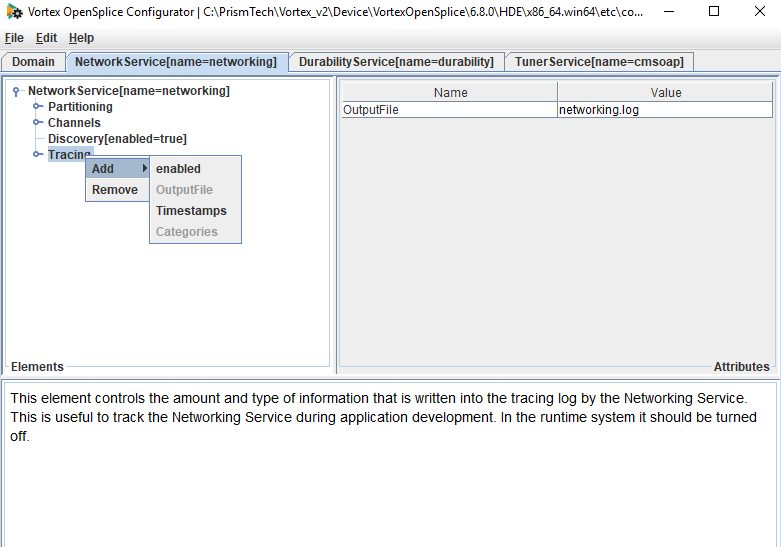
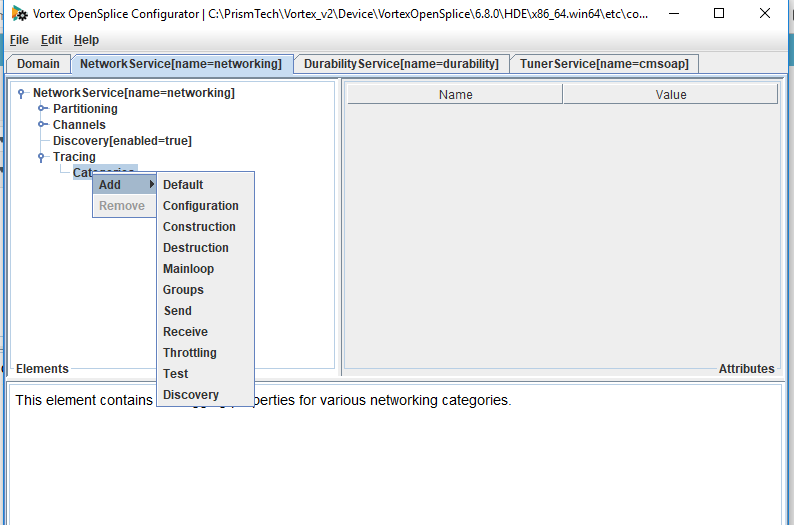
To enable the different logging categories you need to click the little round button beside the word Tracing. This will expand to show the categories underneath the tracing section.
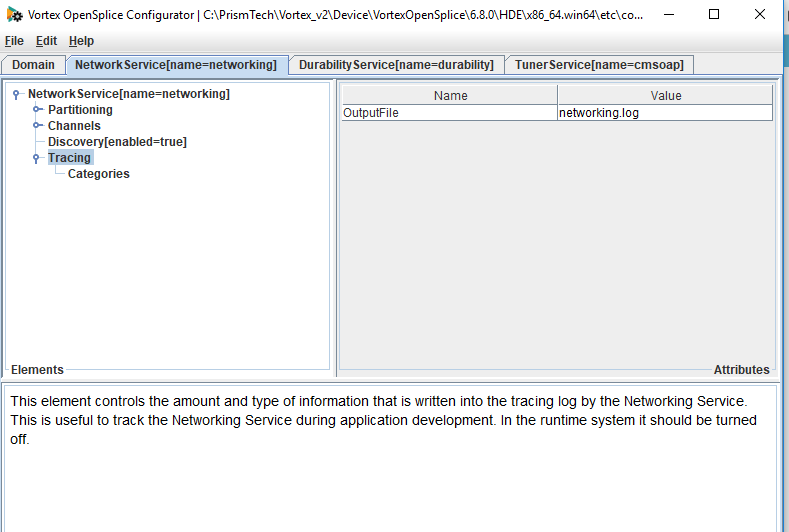
To add a category right click and choose Add > Category from the menu. The tracing level can then be changed in the box on the right hand side.
DDSI2 and DDSI2E Networking Service Logging
By default DDSI2 and DDSI2E write FATAL and ERROR messages into the ospl-error log and WARN messages into the ospl-info.log. If you require more detailed tracing you can enable the DDSI2 and DDSI2E logging to be written into a separate file.
DDSI2 and DDSI2E can produce highly detailed traces of all the traffic and internal activities. You can choose to enable the full logging which will track everything. Alternatively you can limit the tracing by choosing to just log certain fixed sets of categories within the networking service.
How can I enable DDSI2 and DDSI2E networking service logging?
To enable networking service logging you need to add the Tracing element into the DDSI2 service or DDSI2EService section of the xml file. This element controls the amount and type of information that is written into the tracing log by the DDSI2 or DDSI2E service. The verbosity of the log also needs to be set.
This is an example of how to add the Tracing element into the xml configuration file.
<DDSI2Service name=”ddsi2″>
<Tracing>
<Verbosity>finest</Verbosity>
</Tracing>
</DDSI2Service>
The ospconfig configuration tool should be used to modify the xml file.
Can I change the verbosity of the DDSI2 and DDSI2E networking service logging?
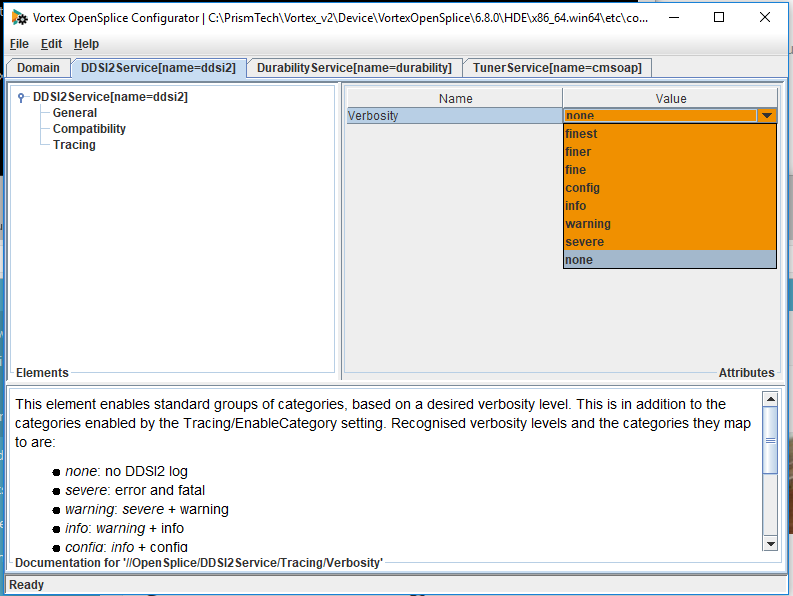
The DDSI2 and DDSI2E service support different levels of verbosity. As well as giving more detailed logs they different levels of verbosity also enable different categories of logging. These are shown below.
- none
- severe – error’ and ‘fatal’
- warning – severe + ‘warning’
- info – warning + info
- config: – info + ‘config’
- fine – config + ‘discovery’
- finer – fine + ‘traffic’, ‘timing’ and ‘info’
- finest – fine + ‘trace’
The higher the verbosity level the more detailed the information. The default value is INFO. The most verbose level is FINEST.
The verbosity can be changed in the xml configuration file. When you have added the Tracing element you just need to set the Verbosity element to the value you want to use. For example to set the verbosity to FINEST:
<DDSI2Service name=”ddsi2″>
<Tracing>
<Verbosity>finest</Verbosity>
</Tracing>
</DDSI2Service>
How can I just track certain categories of DDSI2 and DDSI2E logging?
If you do not want to capture all the networking logging but just want to capture information about certain categories you can do this by using the EnableCategory element in the xml file. You can also use this setting to enable other features in addition to those enabled by setting the verbosity level.
Recognised categories are:
- fatal: all fatal errors, errors causing immediate termination
- error: failures probably impacting correctness but not necessarily causing immediate termination
- warning: abnormal situations that will likely not impact correctness
- config: full dump of the configuration
- info: general informational notices
- discovery: all discovery activity
- data: include data content of samples in traces
- radmin: receive buffer administration
- timing: periodic reporting of CPU loads per thread
- traffic: periodic reporting of total outgoing data
In addition, there is the keyword trace that enables all but radmin . The categorisation of tracing output is incomplete and hence most of the verbosity levels and categories are not of much use in the current release. This is an ongoing process and here we describe the target situation rather than the current situation. Currently, the most useful is trace.
An example xml that just enables the tcp category is as follows:
<DDSI2Service name=”ddsi2″>
<Tracing>
<EnableCategory>tcp</EnableCategory>
</Tracing>
</DDSI2Service>
Can I change the location where the DDSI2 or DDSI2e log file is written?
OutputFile specifies where the DDSI2 or DDSI2e log file is written to. No file is created unless logging categories are enabled using the Tracing/Verbosity or Tracing/EnabledCategory settings. The default value for the file is ddsi2.log
To add a location for the OutputFile you need to add the OutputFile element under the tracing section of the DDSI2 or DDSI2e logging. The value “stdout” is considered a legal value that represents “standard out” and “stderr” is a legal value representing “standard error”. The value can also be set to the filename. If this is not set the logging will not be saved to a file.
An example of the configuration file:
<DDSI2Service name=”ddsi2″>
<Tracing>
<Verbosity>finest</Verbosity>
<OutputFile>ddsi2.log</OutputFile>
</Tracing>
</DDSI2Service>
Can I create new log files when I restart the service?
By default a new log file is generated when the service is restarted. This is the best option when you are generating a detailed log. If you wish to append to the old log each time you restart you can use the AppendToFile element in the xml file. The default value is false. To append to an existing log file you need to change this to true.
This is an example of the configuration file that shows AppendToFile set to true.
<DDSI2Service name=”ddsi2″>
<Tracing>
<Verbosity>finest</Verbosity>
<AppendToFile>true</AppendToFile>
</Tracing>
</DDSI2Service>
How can I add timestamps into the DDSI and DDSI2 logs?
By default timestamps are already written into the log files and these values are absolute compared to the start up time of the service. The configuration tool shows values for timestamps and verbosity but setting these will have no effect. The timestamps can not be turned off in the log file.
Can I send the network packets into a capture file to be read by wireshark or similar?
This can be done by using the PacketCaptureFile element under the Tracing element. This allows you to set the name of the file where received and sent packets will be logged in “pcap” format. These can then be analysed by common networking tools such as wireshark.
Please note that the IP and UDP headers are fictitious. This is because wireshark captures everything on the wire and you will get real ethernet, IP and UDP values in the capture. DDSI2 and DDSI2E writes the data into files for wireshark to read but it does not have this information. This is because it is not capturing the network traffic but instead is interacting with UDP as an application. In order to allow you to tell the difference between sent and received packets you can look at the TTL field. This value is set to 255 for sent packets and 128 for received packets. This currently is for IPV4 only.
An example of the configuration file where the packets are captured in a file called packets.log is shown below:
<DDSI2Service name=”ddsi2″>
<Tracing>
<Verbosity>finest</Verbosity>
<PacketCaptureFile>packets.log</Pack
</Tracing>
</DDSI2Service>
Enabling DDSI2 and DDSI2E logging with the OpenSplice configuration tool
It is always advisable to modify your xml configuration files with the OpenSplice configuration tool. This enables you to edit your files with the graphical interface and has built in error checking to ensure the xml file is valid. To start the configuration tool either start it from the launcher or use the command
osplconf
in an command window that has been configured for OpenSplice. When the configuration tool appears open the xml file you wish to edit using File >Open and choosing the right xml file.
To enable DDSI2 or DDSI2E service tracing click on the tab that says DDSI2Service or DDSI” then right click on DurabilityService and choose Add > Tracing from the menu that appears. The tracing element should appear in the box on the right hand side.
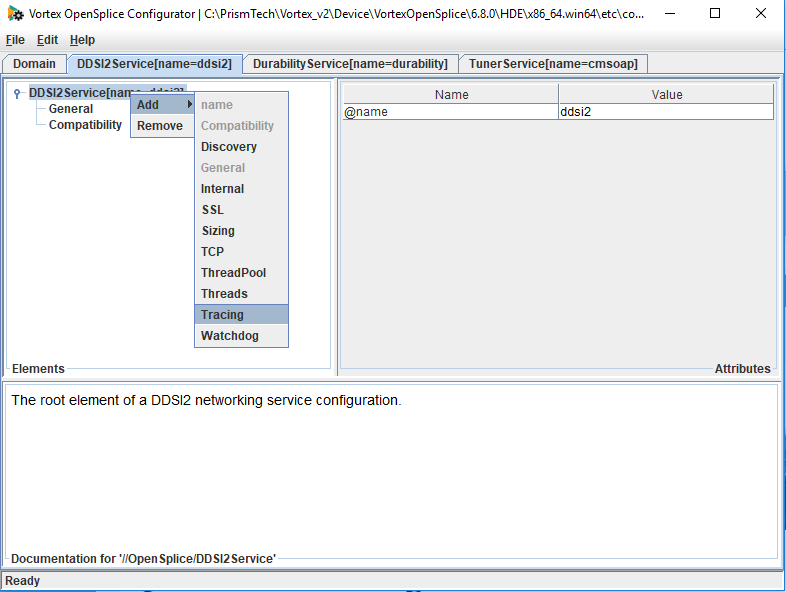
Once the Tracing element has been added you can choose to add other elements to the ddsi2 logging including AppendToFile, EnableCategory, OutputFile, PacketCaptureFile and Verbosity. Please note that while you can add timestamps these are always enabled and changing this value will not do anything.
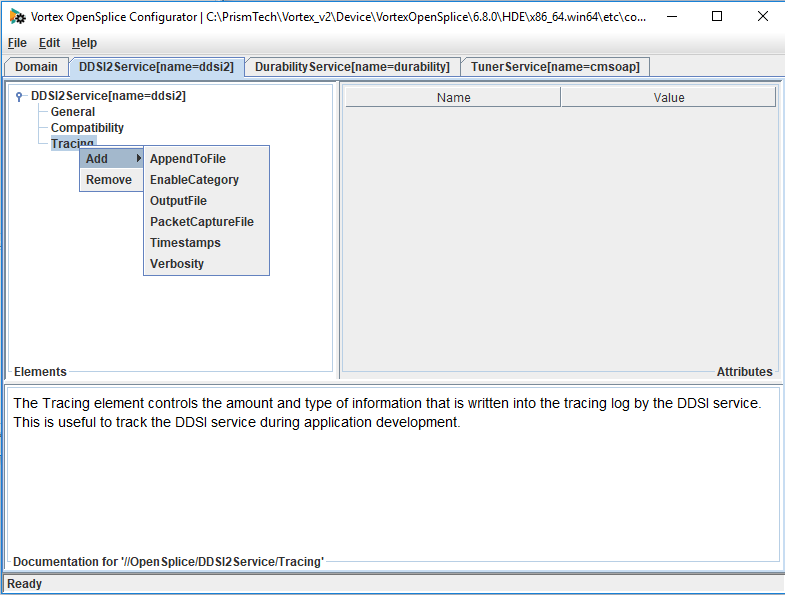
When you add the relevant value it will appear on the right hand side of the screen. You can change the values either by using the drop down menu or typing the correct value into the box.
Is it possible to limit the size of the OpenSplice log files?
If you are using OpenSplice 6.9.2p1 or above it is possible to do this using a third party utility – LogRotate.
Please see How to use LogRotate to limit the size of the OpenSplice log files

