When you are developing a DDS system you may want to gather OpenSplice statistics to help you tune the system. This article explains how to do this.
Various statistics can be generated by OpenSplice. These will help you analyse and tune application behaviour while you are developing the system. By default statistics are not enabled. This is because using statistics introduces extra overhead so it is usual to turn statistics off in a runtime system.
Gathering OpenSplice statistics
What statistics does OpenSplice generate?
OpenSplice will generate statistics for the cmsoap service by default.
You can set up OpenSplice to generate statistics for Readers, Writers, the Durability Service and the RT Networking Service. If you are using DDSI2 networking service you can capture information using wireshark. You need to use the RTPS2 plugin which wireshark supports.
How do you enable statistics?
By default, statistics are turned off except for the cmsoap statistics. To enable the gathering of statistics you need to enable this in the OpenSplice configuration file. The best way to do this is by using the osplconf tool. This will check the configuration to ensure it is correct.
Enabling statistics using the OpenSplice configuration tool
Start the OpenSplice configuration tool. This can be done from the OpenSplice launcher by clicking the tools button and then choosing configuration.

Alternatively you can start it from the a command prompt which has been configured for running OpenSplice. Use the command:
osplconf
The OpenSplice configuration tool should appear. From the menu choose File > Open and choose the xml configuration file you are using. A number of tabs should appear which relate to the configuration.
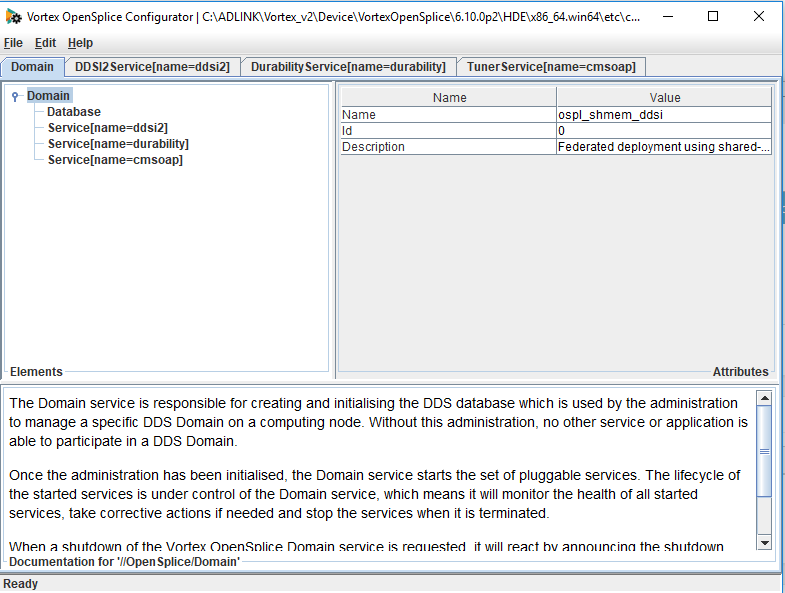
Go to the domain tab and right click on domain.
From the menu choose Add > Statistics.
The Statistics option should appear in the list of items under Domain.
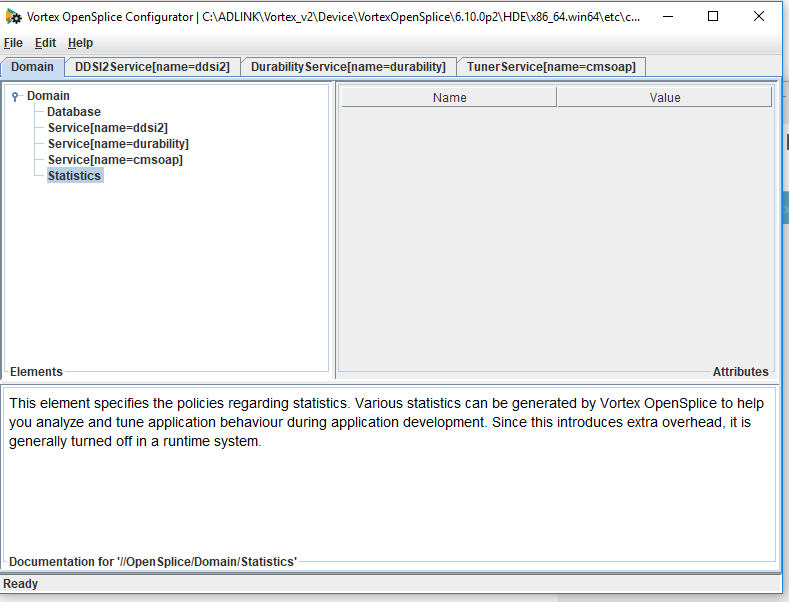
Right click on statistics
Choose Add > Category from the menu
Add Category
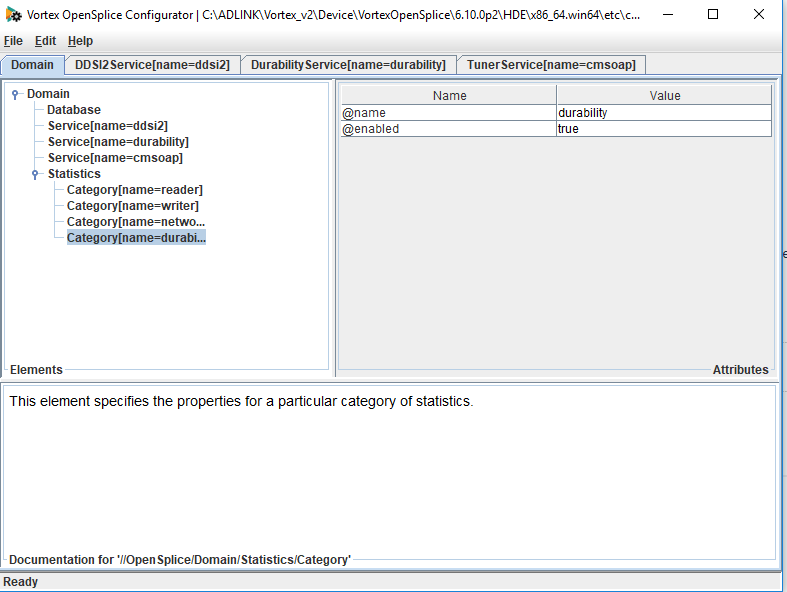
The category will appear under the statistics section. If you click on it you will see the name and value in the left hand pane.
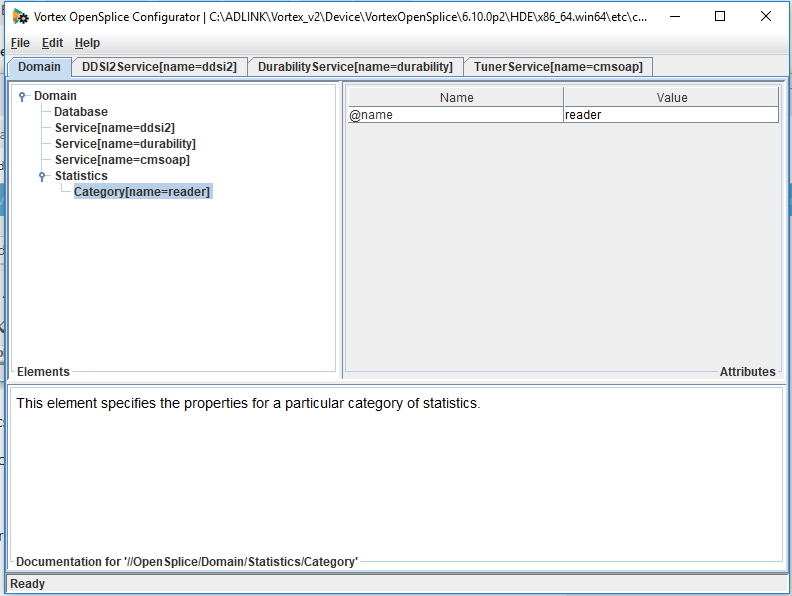
By default the category is reader which will capture statistics about readers. You can change this value to writer, durability or networking by clicking the value pane which will bring up a drop down menu. Just click on the value you want.

You can add additional statistics categories by repeating these steps.
Each category also has an additional attribute you can add called enabled. By default this is set to true. Adding this provides an easy way to disable statistics when you no longer want to capture them.
To add this right click on the Category(name=xxx) option.
Choose Add > Enabled
You will see this setting in the left hand pane. When you want to disable it just change the value to false by clicking on the value in the panel and choosing false from the drop down list.
When you have finished choose File > Save from the main menu to save the configuration file.
Enabling statistics in the OpenSplice configuration file
If you want to enable statistics in the OpenSplice configuration file directly you need to add the following into your xml file in the Domain section.
<Domain>
<Statistics>
<Category name=”reader”/>
<Category name=”writer”/>
<Category name=”networking”/>
<Category name=”durability”/>
</Statistics>
</Domain>
You only need to add the <Category name=””> for the statistics you want to enable. All values have been shown for completeness.
If you also want to add the enabled values to each of the categories so you can easily turn off the statistics later the xml file will look like this:
<Domain>
<Statistics>
<Category enabled=”true” name=”reader”/>
<Category enabled=”true” name=”writer”/>
<Category enabled=”true” name=”networking”/>
<Category enabled=”true” name=”durability”/>
</Statistics>
</Domain>
What statistics are gathered when statistics are enabled?
The following entities will show statistics:
- Reader
- Writer
- Durability
- Networking
- CMSOAP
Reader Statistics
| Name | Field | Information |
|---|---|---|
| lastReset | Time the field was last reset | |
| maxSampleSize | value | |
| maxSampleSize | lastUpdate | Time the field was last updated |
| maxSamplesPerInstance | value | |
| maxSamplesPerInstance | lastUpdate | Time the field was last updated |
| maxNumberof Samples | value | |
| maxNumberof Samples | lastUpdate | Time the field was last updated |
| maxNumberOfInstances | value | |
| maxNumberOfInstances | lastUpdate | Time the field was last updated |
| NumberOfSamples | ||
| NumberOfInstances | ||
| readLatency | value | |
| readLatency | Min,value | |
| readLatency | Min.LastUpdateTime | |
| readLatency | Max.value | |
| readLatency | Max.lastUpdateTime | |
| readLatency | Avg.value | |
| readLatency | Avg.count | |
| transportLatency | value | |
| transportLatency | Min,value | |
| transportLatency | Min.LastUpdateTime | |
| transportLatency | Max.value | |
| transportLatency | Max.lastUpdateTime | |
| transportLatency | Avg.value | |
| transportLatency | Avg.count | |
| numberOfInstancesWithStatusNew | ||
| numberOfInstancesWithStatusAlive | ||
| numberOfInstancesWithStatusDisposed | ||
| numberOfInstancesWithStatusNoWriters | ||
| numberOfSamplesWithStatusRead | ||
| numberOfSamplesExpired | ||
| numberOfSamplesPurgedByDispose | ||
| numberOfSamplesPurgedByNoWriters | ||
| numberOfSamplesArrived | ||
| numberOfSamplesDiscarded | ||
| numberOfSamplesRead | ||
| numberOfSamplesTaken | ||
| numberOfSamplesLost | ||
| numberOfSamplesRejectedBySamplesLimit | ||
| numberOfSamplesRejectedByInstancesLimit | ||
| numberOfReads | ||
| numberOfInstanceReads | ||
| numberOfInstanceLookups | ||
| numberOfTakes | ||
| numberOfInstanceTakes | ||
| numberOfNextInstanceTakes |
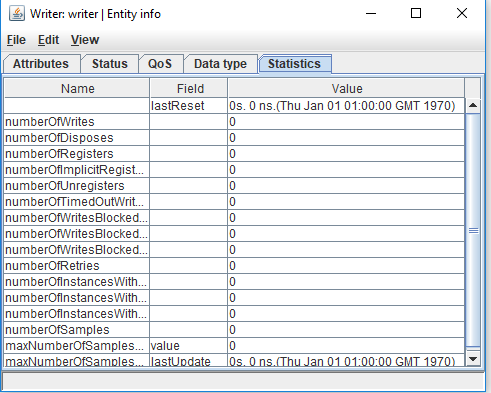
Writer Statistics
| Name | Field | Information |
|---|---|---|
| lastReset | ||
| numberOfWrites | ||
| numberOfDisposes | ||
| numberOfRegisters | ||
| numberOfImplicitRegisters | ||
| numberOfUnregisters | ||
| numberOfTimedOutWriters | ||
| numberOfWritesBlockedBySamplesLimit | ||
| numberOfWritesBlockedByInstanceLimit | ||
| numberOfWritesBlockedBySamplesPerInstanceLimit | ||
| numberOfRetries | ||
| numberOfInstancesWithStatusAlive | ||
| numberOfInstancesWithStatusDisposed | ||
| numberOfInstancesWithStatusUnregistered | ||
| numberOfSamples | ||
| maxNumberOfSamplesPerInstance | value | |
| maxNumberOfSamplesPerInstance | lastUpdate |
Durability Statistics
| Name | Value | Information |
|---|---|---|
| LastReset | Time the values were last reset | |
| persistentSamplesWritten | ||
| fellowsKnownMax | value | |
| fellowsKnownMax | lastUpdate | |
| fellowsKnown | ||
| fellowsApproved | ||
| ellowsIncompatibleState | ||
| fellowsIncompatibleDataModel | ||
| nameSpacesKnown | ||
| nameSpacesMaster | ||
| nameSpacesSlave | ||
| groupsToCreateTotal | ||
| groupsToCreateVolatile | ||
| groupsToCreateTransient | ||
| groupsToCreatePersistent | ||
| groupsKnownTotal | ||
| groupsKnownVolatile | ||
| groupsKnownTransient | ||
| groupsKnownPersistent | ||
| groupsCompleteTotal | ||
| groupsCompleteVolatile | ||
| groupsCompleteTransient | ||
| groupsCompletePersistent | ||
| groupsIncompleteVolatile | ||
| groupsIncompleteTransient | ||
| groupsIncompletePersistent | ||
| groupsIgnoredTotal | ||
| groupsIgnoredVolatile | ||
| groupsIgnoredTransient | ||
| groupsIgnoredPersistent | ||
| alignerRequestsReceived | ||
| alignerRequestsIgnored | ||
| alignerRequestsAnswered | ||
| AlignerRequestsOpen | ||
| AlignerRequestOpenMax | value | |
| AlignerRequestOpenMax | lastUpdate | |
| alignerRequestCombined | ||
| alignerRequestsCombinedOpen | ||
| alignerRequestCombinedOpenMax | value | |
| alignerRequestCombinedOpenMax | lastUpdate | |
| alignerRequestsCombinedAnswered |
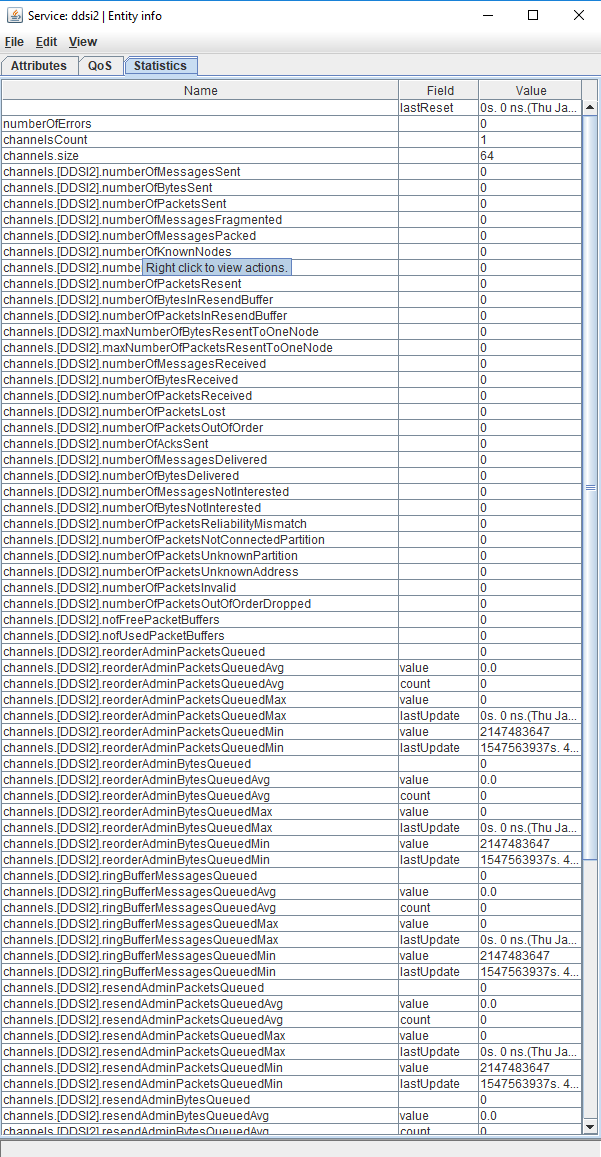
Networking Statistics
| Name | Value | Information |
|---|---|---|
| lastReset | Time the value was last reset | |
| numberOfErrors | ||
| channelsCount | ||
| channels.size | ||
| channels.[DDSI2].numberOfMessagesSent | ||
| channels.[DDSI2].numberOfBytesSent | ||
| channels.[DDSI2].numberOfPacketsSent | ||
| channels.[DDSI2].numberOfMessagesFragmented | ||
| channels.[DDSI2].numberOfKnownNodes | ||
| channels.[DDSI2].numberOfBytesResent | ||
| channels.[DDSI2].numberOfPacketsResent | ||
| channels.[DDSI2].numberOfBytesInResendBuffer | ||
| channels.[DDSI2].numberOfBytesResentToOneNode | ||
| channels.[DDSI2].numberOfPacketsResentToOneNode | ||
| channels.[DDSI2].numberOfMessagesReceived | ||
| channels.[DDSI2].numberOfBytesReceived | ||
| channels.[DDSI2].numberOfPacketsReceived | ||
| channels.[DDSI2].numberOfPacketsLost | ||
| channels.[DDSI2].numberOfPacketsOutOfOrder | ||
| channels.[DDSI2].numberOfAcksSent | ||
| channels.[DDSI2].numberOfMessagesDelivered | ||
| channels.[DDSI2].numberOfBytesDelivered | ||
| channels.[DDSI2].numberOfMessagesNotInterested | ||
| channels.[DDSI2].numberOfBytesNotInterested | ||
| channels.[DDSI2].numberOfPacketsReliabilityMisMatch | ||
| channels.[DDSI2].numberOfPacketsNotConnectedPartition | ||
| channels.[DDSI2].numberOfPacketsUnknownPartition | ||
| channels.[DDSI2].numberOfPacketsUnknownAddress | ||
| channels.[DDSI2].numberOfPacketsInvalid | ||
| channels.[DDSI2].numberOfPacketsOutOfOrderDropped | ||
| channels.[DDSI2].noFreePacketBuffers | ||
| channels.[DDSI2].noUsedPacketBuffers | ||
| channels.[DDSI2].reorderAdminPacketsQueued | ||
| channels.[DDSI2].reorderAdminPacketsQueuedAvg | value | |
| channels.[DDSI2].reorderAdminPacketsQueuedAvg | count | |
| channels.[DDSI2].reorderAdminPacketsQueuedMax | value | |
| channels.[DDSI2].reorderAdminPacketsQueuedMax | lastUpdate | |
| channels.[DDSI2].reorderAdminPacketsQueuedMin | value | |
| channels.[DDSI2].reorderAdminPacketsQueuedMin | lastUpdate | |
| channels.[DDSI2].ringBufferMessagesQueued | ||
| channels.[DDSI2].ringBufferMessagesQueuedAvg | count | |
| channels.[DDSI2].ringBufferMessagesQueuedAvg | lastUpdate | |
| channels.[DDSI2].ringBufferMessagesQueued | ||
| channels.[DDSI2].ringBufferMessagesQueuedMax | value | |
| channels.[DDSI2].ringBufferMessagesQueuedMax | lastUpdate | |
| channels.[DDSI2].ringBufferMessagesQueuedMin | value | |
| channels.[DDSI2].ringBufferMessagesQueuedMin | lastUpdate | |
| channels.[DDSI2].resendAdminPacketsQueued | ||
| channels.[DDSI2].resendAdminPacketsQueuedAvg | count | |
| channels.[DDSI2].resendAdminPacketsQueuedAvg | lastUpdate | |
| channels.[DDSI2].resendAdminPacketsQueuedMax | value | |
| channels.[DDSI2].resendAdminPacketsQueuedMax | lastUpdate | |
| channels.[DDSI2].resendAdminPacketsQueuedMin | value | |
| channels.[DDSI2].resendAdminPacketsQueuedMin | lastUpdate | |
| channels.[DDSI2].resendAdminBytesQueued | ||
| channels.[DDSI2].resendAdminBytesQueuedAvg | value | |
| channels.[DDSI2].resendAdminBytesQueuedAvg | count | |
| channels.[DDSI2].resendAdminBytesQueuedMax | value | |
| channels.[DDSI2].resendAdminBytesQueuedMax | lastUpdate | |
| channels.[DDSI2].resendAdminBytesQueuedMin | value | |
| channels.[DDSI2].resendAdminBytesQueuedMin | lastUpdate | |
| channels.[DDSI2].adminQueueAcks | value | |
| channels.[DDSI2].adminQueueAcks | Min.value | |
| channels.[DDSI2].adminQueueAcks | Min.lastUpdate | |
| channels.[DDSI2].adminQueueAcks | Max.value | |
| channels.[DDSI2].adminQueueAcks | Max.lastUpdate | |
| channels.[DDSI2].adminQueueAcks | Avg.value | |
| channels.[DDSI2].adminQueueAcks | Avg.count | |
| channels.[DDSI2].adminQueueData | Value | |
| channels.[DDSI2].adminQueueData | Min.value | |
| channels.[DDSI2].adminQueueData | Min.lastUpdate | |
| channels.[DDSI2].adminQueueData | Max.value | |
| channels.[DDSI2].adminQueueData | Max.lastUpdate | |
| channels.[DDSI2].adminQueueData | Avg.value | |
| channels.[DDSI2].adminQueueData | Avg.count | |
| channels.[DDSI2].noBytesBeforeCompression | ||
| channels.[DDSI2].noBytesAfterCompression | ||
| channels.[DDSI2].noBytesBeforeDecompression | ||
| channels.[DDSI2].noBytesAfterDecompression |
CMSOAP Statistics
| Name | Field | Information |
|---|---|---|
| LastReset | time the field was last reset to zero | |
| maxConnectedClients | Value | Maximum number of clients connected to the cmsoap service |
| maxConnectedClients | lastUpdate | Last update time for the maxConnectedClients field |
| maxClientThreads | Value | Maximum number of client threads connected to the cmsoap service |
| maxClientThreads | lastUpdate | Last update time for the maxClientThreads field |
| connectedClients | Number of clients connected to the cmsoap service | |
| clientThreads | Number of client threads used by the cmsoap service | |
| requestsHandled | How many requests the cmsoap service has handled |
How do you view the statistics?
You can view OpenSplice statistics using the OpenSplice Tuner or OpenSplice Tester. If you haven’t enabled statistics in the configuration you will not be able to view them so make sure you have done this first.
Viewing statistics using the tuner
You can configure the statistics to update automatically. This is done by going to the Edit Menu and choosing OpenSplice Tuner Preferences. Set the Auto update entity configuration option to on.
You can monitor the statistical information by selecting the Statistics tab in the entity information window. Examples showing how to do this are shown below.
To view the statistics using the tuner first start the tuner. This can be done from the OpenSplice launcher or by typing ospltun on the command line.
Connect to the DDS domain you are using. If you need more information about using the tuner this video shows you how to get started using the tuner. Alternatively, you can check the OpenSplice Tuner Guide in the OpenSplice Documentation.
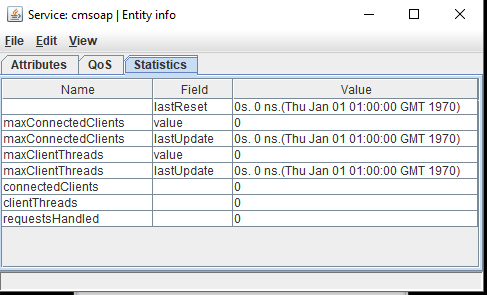
To see the CMSOAP statistics
From the menu choose View > Participant View.
You will see a list of participants in the DDS domain. Double click on the CMSOAP service or right click it and choose display entity from the menu.
The Entity Info window appears. Click on the statistics tab and you can see the statistics.
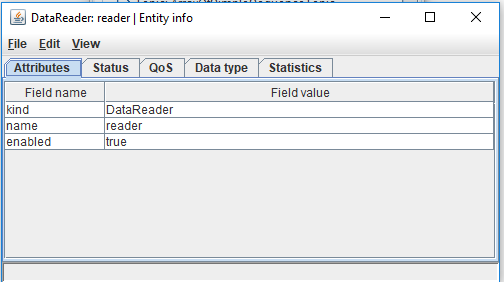
To see the reader statistics
To see the reader statistics you will need to create a reader. You can do this with the following steps:
- First create a subscriber by choosing Edit > Create Subscriber from the menu
- Now create a reader by choosing Edit > Create Reader from the menu. You can choose the topic to create it on.
- In the View Menu choose Topics
- Click the Display Entity Relations tick box
- Go to the topic where you created the reader and click beside the topic to expand the view
- Choose the reader from the list and double click it or right click and choose display entity from the menu.
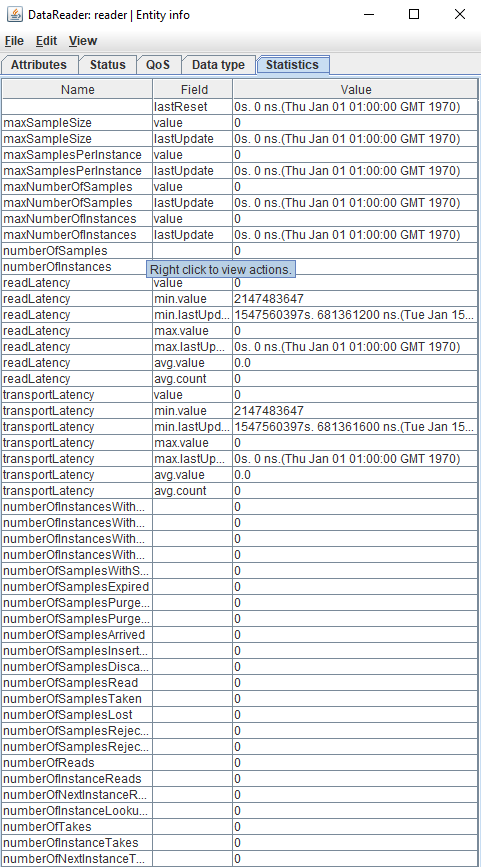
- On the Entity Information window click the statistics tab to see the statistics.
The statistics view appears
To see the writer statistics
To see the writer statistics you will need to create a writer. You can do this with the following steps:
- First create a publisher by choosing Edit > Create Publisher from the menu
- Now create a writer by choosing Edit > Create Writer from the menu. You can choose the topic to create it on.
- In the View Menu choose Topics
- Click the Display Entity Relations tick box
- Go to the topic where you created the writer and click beside the topic to expand the view
- Choose the writer from the list and double click it or right click and choose display entity from the menu.
- On the Entity Information window click the statistics tab to see the statistics.
To view the Durability statistics
- In the tuner menu choose View > Participant View
- From the list choose Service:durablity
- Double click it or right click and choose display entity from the menu
- When the Entity Information view appears choose the statistics tab

To view the Networking statistics
- In the tuner menu choose View > Participant View
- From the list choose Service:networking
- Double click it or right click and choose display entity from the menu
- When the Entity Information view appears choose the statistics tab
Please note you will only see statistics if you are using the RTNetworking service.
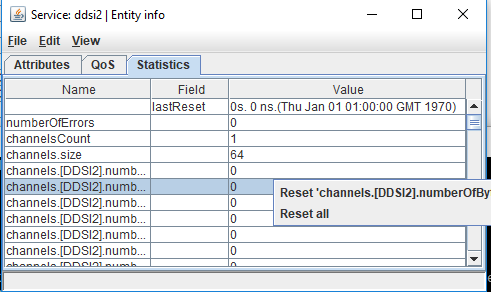
Resetting the statistical information
As well as monitoring statistical information you can also reset these statistics using the tuner. When you right click on a specific row in the table a popup menu with two options appears. The first option allows you to reset the selected counter. The second option will reset all the statistics for this entity.